August 06, 2026
Geopolitics and soaring refining margins are dominating the news. Your long-term, passive portfolio is already designed to handle the noise—no active trading required.
Every few years, financial markets are hit with an uncomfortable reminder: energy sits at the center of the global economy.
Whether driven by conflict in the Middle East, shipping bottlenecks in the Strait of Hormuz, or refinery outages, oil disruptions ripple through virtually every sector. Petroleum powers over 90% of global transportation and serves as a vital input for agriculture, aviation, plastics, and pharmaceuticals.1 When energy prices surge, corporate costs rise and central banks rethink rate cuts.
When these headlines break, investors inevitably ask: "Should I be changing my portfolio?"
The short answer is no.
Major energy shocks—from the 1973 embargo to the 2022 war in Ukraine and today's war in Iran—frequently drive double-digit commodity spikes and push refining margins to record highs.2 The temptation to react is understandable, but translating headline drama into trading decisions introduces unnecessary risk.
Behavioral finance shows that we feel the pain of financial losses far more intensely than the joy of equivalent gains.3 During periods of geopolitical uncertainty, this loss aversion creates a common panic trap.
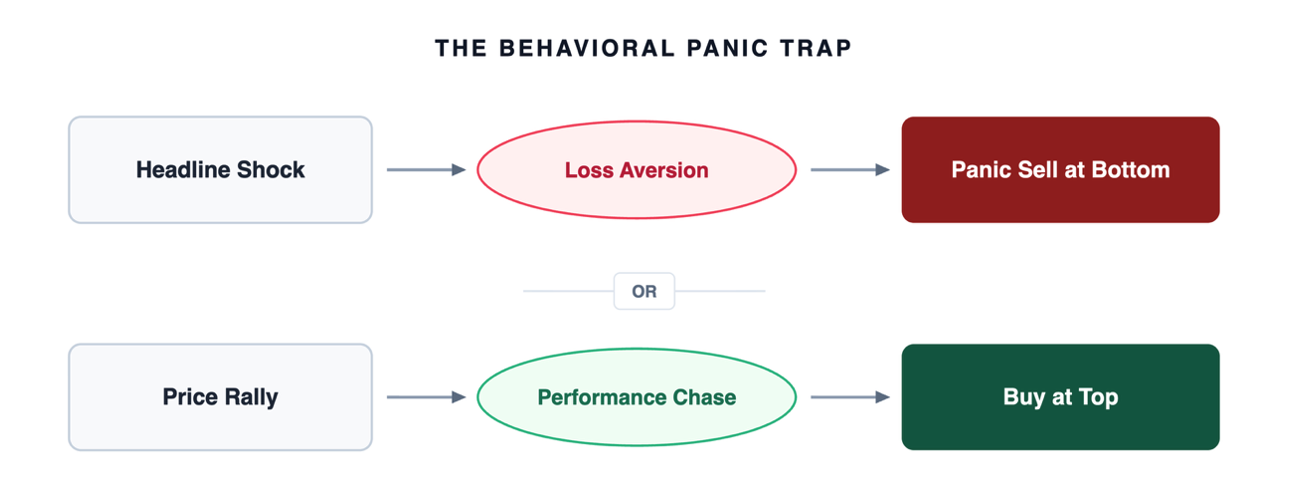
Trying to trade energy shocks requires navigating a multi-layered global system rather than a single ticker symbol.
Consider the volatility of 2026:
In the months leading up to these events, oil markets operated in a calm, baseline environment with West Texas Intermediate (WTI) crude trading in the low $60s.4 As headlines broke throughout 2026, market behavior swung sharply as prices spiked toward $110 following the February strikes, collapsed back toward $70 during the April ceasefire relief, consolidated through June's diplomatic talks, and surged back to $90 after July's renewed strikes voided the MOU.5
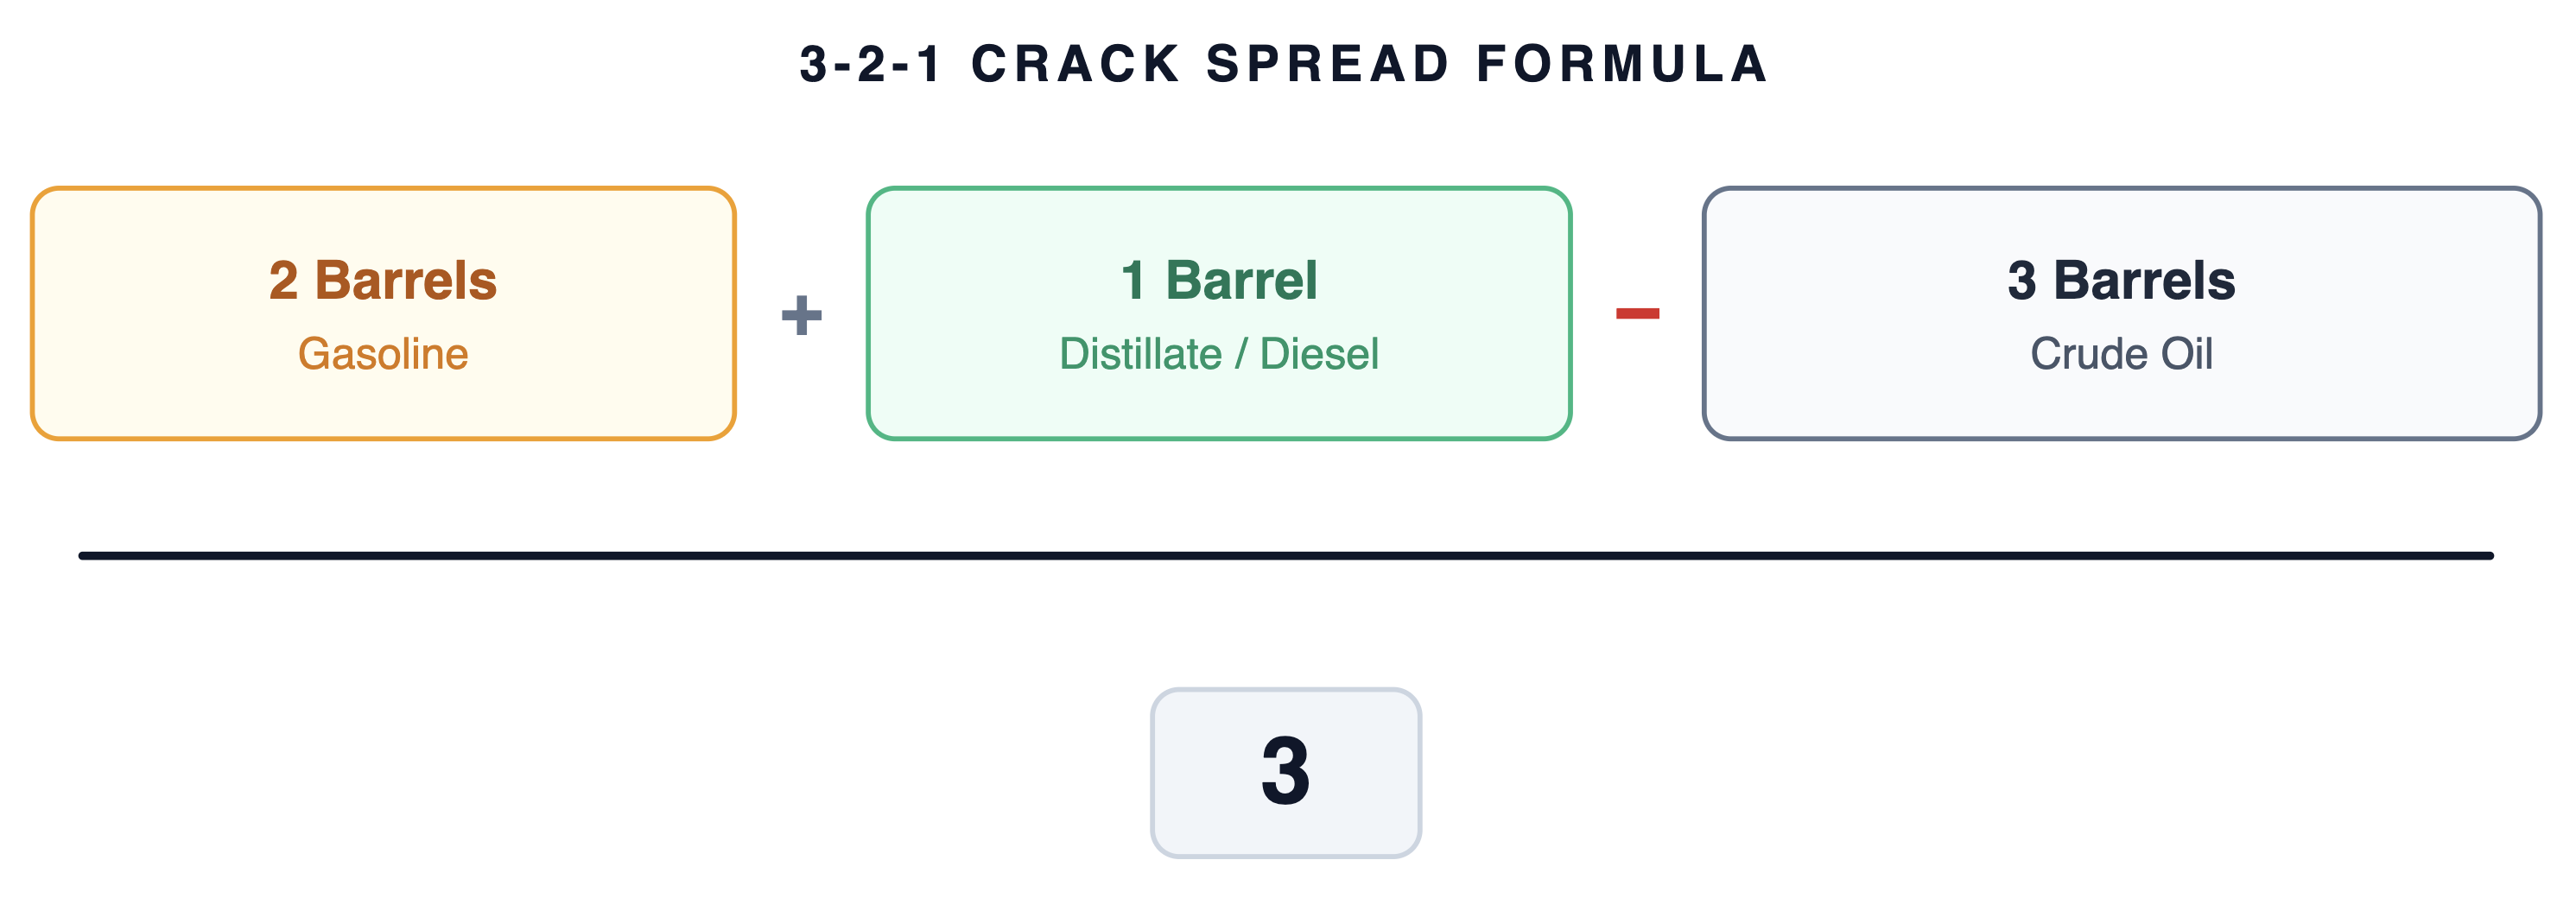
Simultaneously, on July 16, 2026, the US 3-2-1 crack spread—the margin refiners earn converting crude into gasoline and diesel—also hit a record high near $70 per barrel.6 While raw crude prices swung unpredictably, consumer fuel prices stayed elevated due to refining bottlenecks and shipping constraints.
The crack spread illustrates the standard industry formula used to calculate a refiner's gross profit margin per barrel. It takes the combined market value of two barrels of gasoline and one barrel of distillate/diesel, subtracts the cost of three barrels of unrefined crude oil, and divides the result by three to determine the average margin earned from processing raw crude into usable fuel. The formula uses this specific 3-2-1 ratio because standard petroleum refineries typically yield roughly two barrels of gasoline and one barrel of distillate fuel (such as diesel or jet fuel) for every three barrels of crude oil they process.
To successfully time an energy shock, an investor would need to correctly predict crude futures, refining margins, shipping friction, and market psychology all at once. Beyond commodity volatility, the 2026 disruption created broad economic pressures:
The critical point here is that you do not need to guess where oil prices, crack spreads, or geopolitics will go next. A disciplined, passively diversified portfolio should hold the broader market, absorbing the shocks and capturing economic realignment without falling into the headline panic trap.
The 2026 Middle East conflict highlights why timing localized geopolitical shocks is an impossible task for investors.
At the heart of the disruption is the Strait of Hormuz, a maritime corridor that handled over 20 million barrels per day in 2025, which is roughly 20% of global petroleum liquids alongside liquified natural gas (LNG) volumes.8 Major Middle Eastern producers depend on this single passage. Because oil cannot be rerouted overnight due to finite pipeline capacities and limited strategic reserves, even the mere threat of friction causes wild price swings based on fear rather than actual physical shortages.
Focusing solely on crude futures misses the broader structural friction across the supply chain. Tightened global refinery capacity and war damage severely reduced processing capabilities in the region, while surging war-risk insurance premiums for Persian Gulf tankers spiked the landed cost of crude regardless of paper futures prices.9 Compounding the issue, finished fuel stocks were already sitting near multi-decade lows before the conflict even began.
Ultimately, energy markets represent a complex, interconnected web of extraction, shipping, refining, and insurance. Broad diversification remains an effective shield against these multi-layered dynamics. While active traders may repeatedly respond to the volatility of headlines, long-term, passive portfolios simply absorb the noise.
Over the last 50+ years, major oil price shocks have repeatedly driven economic volatility. Yet markets, consumers, and policy have consistently adapted and recovered.
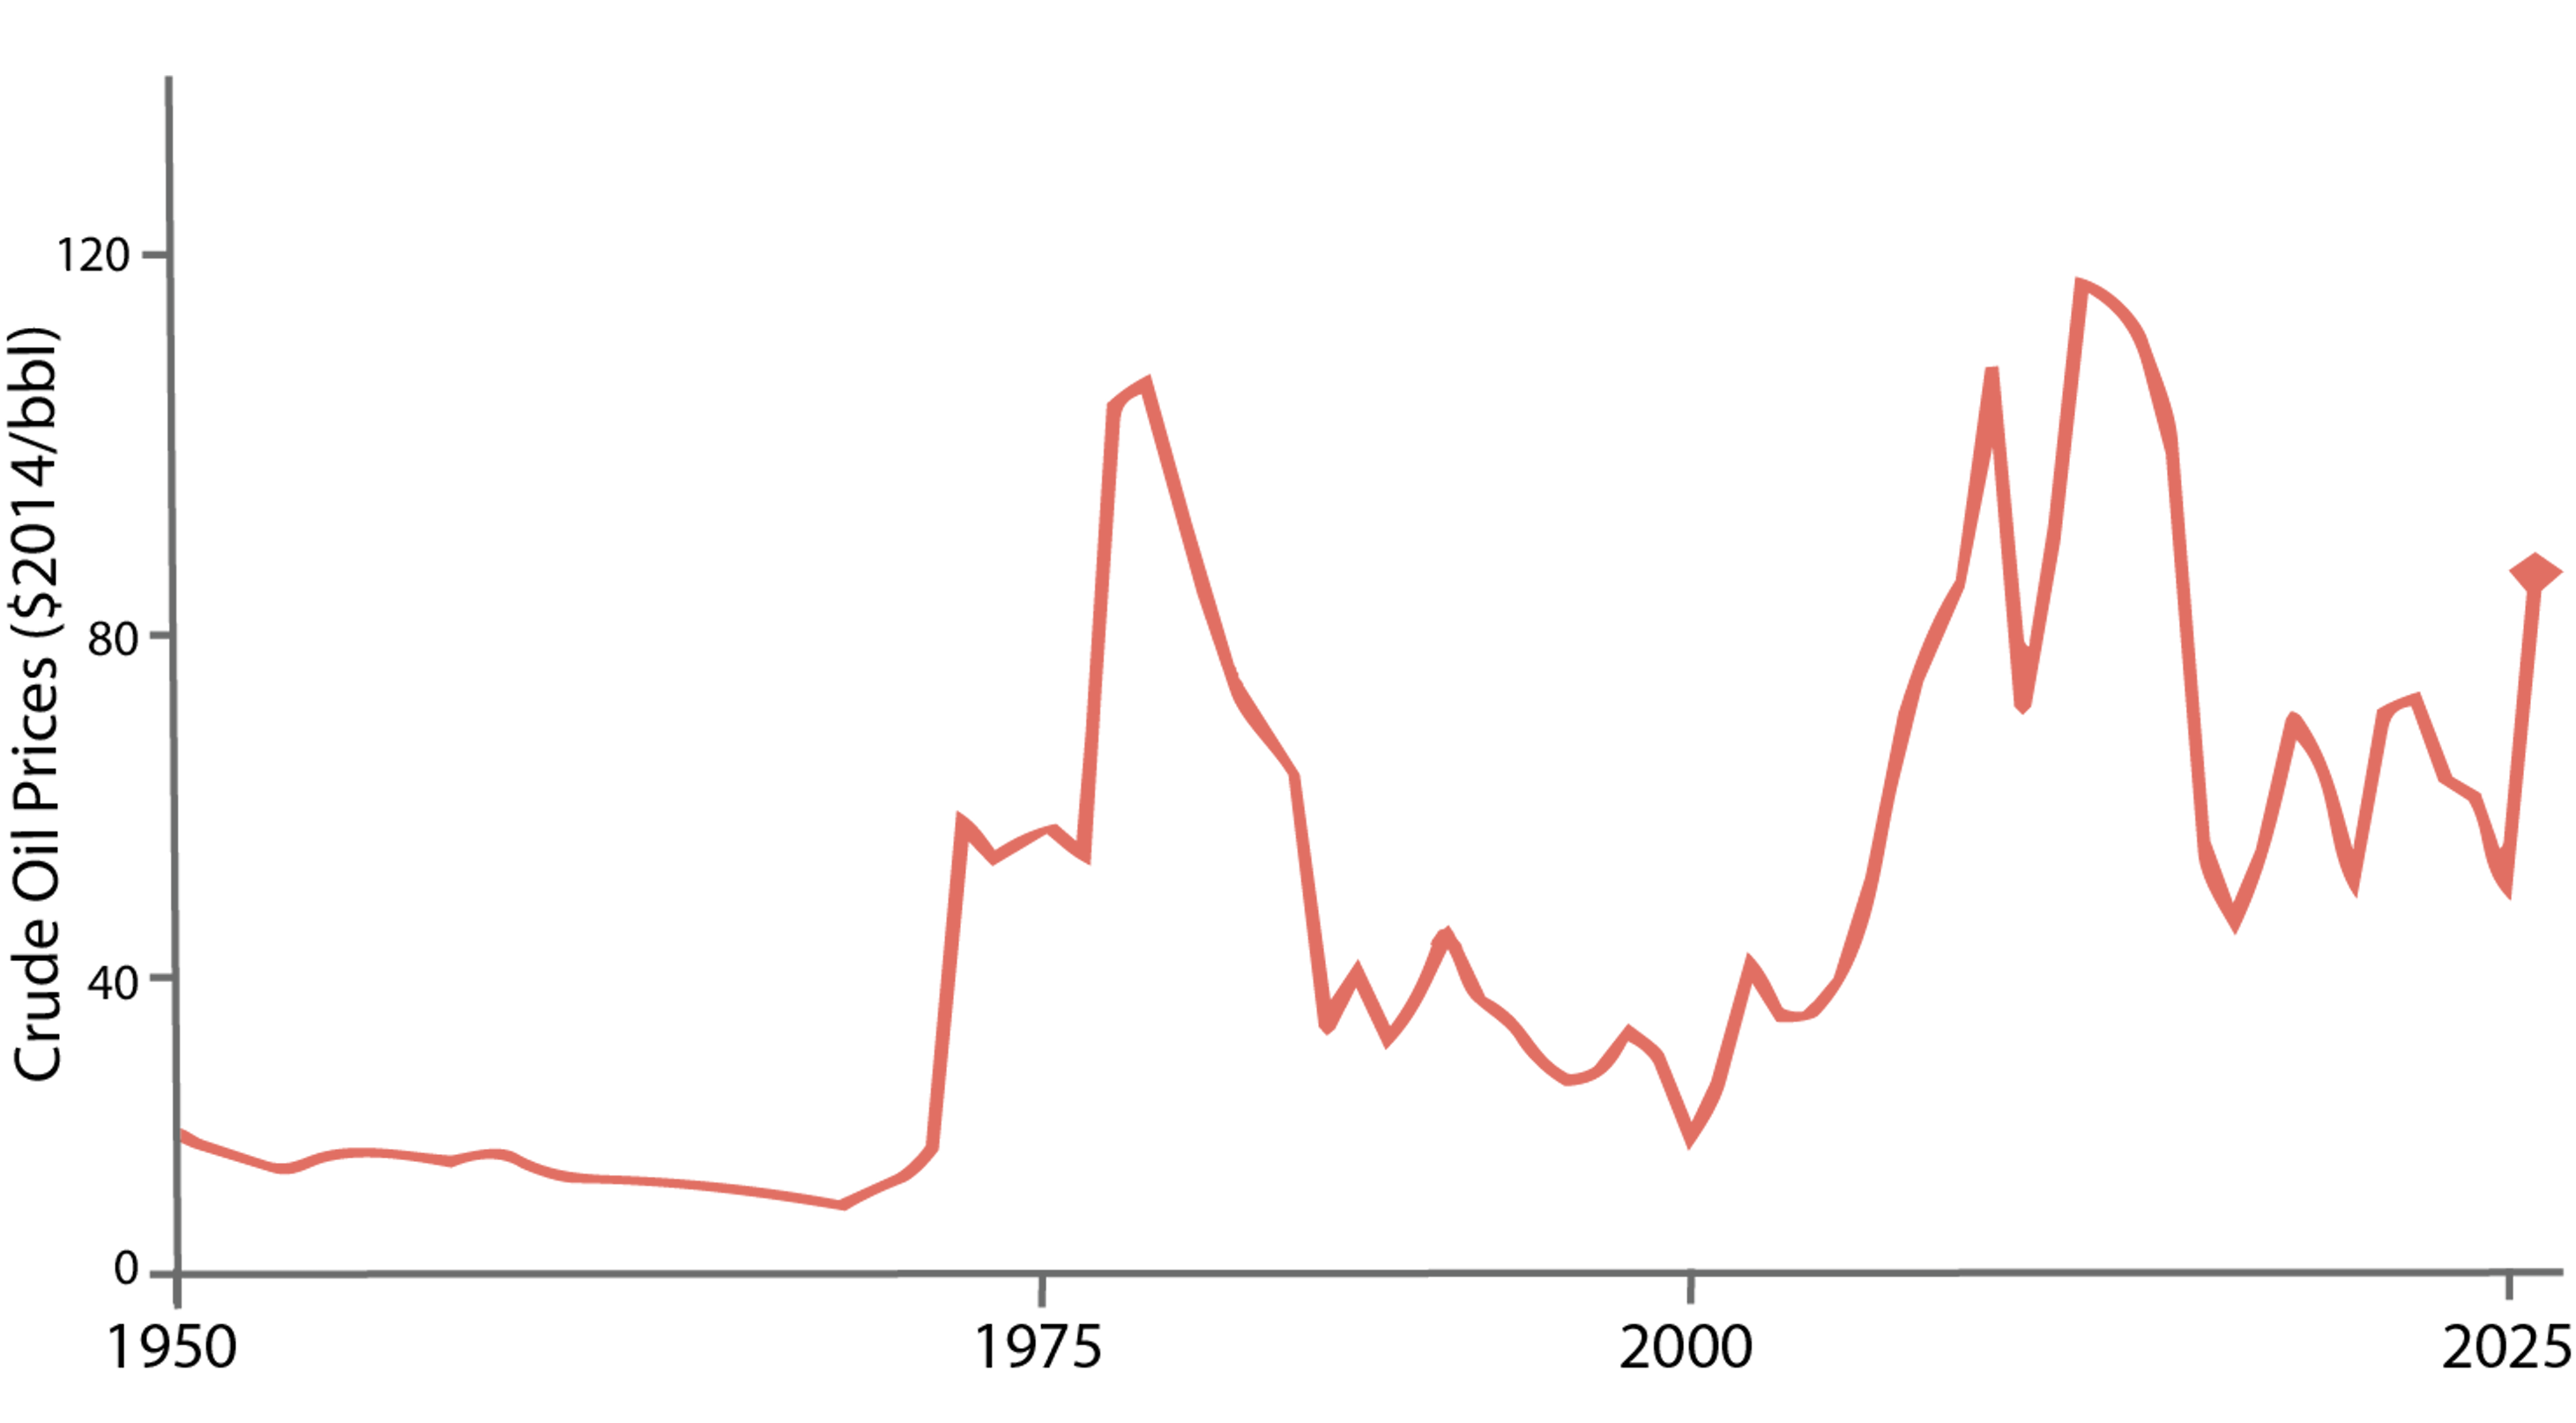
Source: https://media.onedayinjuly.com/media/images/Spring_2026_Quarterly_Booklet-Web.pdf
1973 OPEC Oil Embargo10
1978–1979 Iranian Revolution12
1990 Gulf War13
Mid-2010s Supply Glut14
2020 Pandemic Collapse15
2022 Russia-Ukraine War16
The important historical insight remains unchanged. Whether a shock is supply- or demand-driven, the end result is consistent: economies adapt, new equilibriums form, and disciplined, long-term investors historically have been rewarded for staying the course.
The Iran conflict has generated a constant stream of geopolitical catalysts, with rounds of ceasefires and escalations shaking markets for months. Attempting to trade each headline requires getting the exposure, direction, and timing right all at once—a near-impossible task. Geopolitical events are inherently unpredictable, which is precisely why markets react so sharply to new developments.
Passive, index-based investing does not assume global crises can be predicted. No investor can consistently forecast geopolitical moves, inflation stickiness, or central bank decisions. Instead of betting on unknowable outcomes, broad diversification embraces uncertainty as a permanent feature of the market.
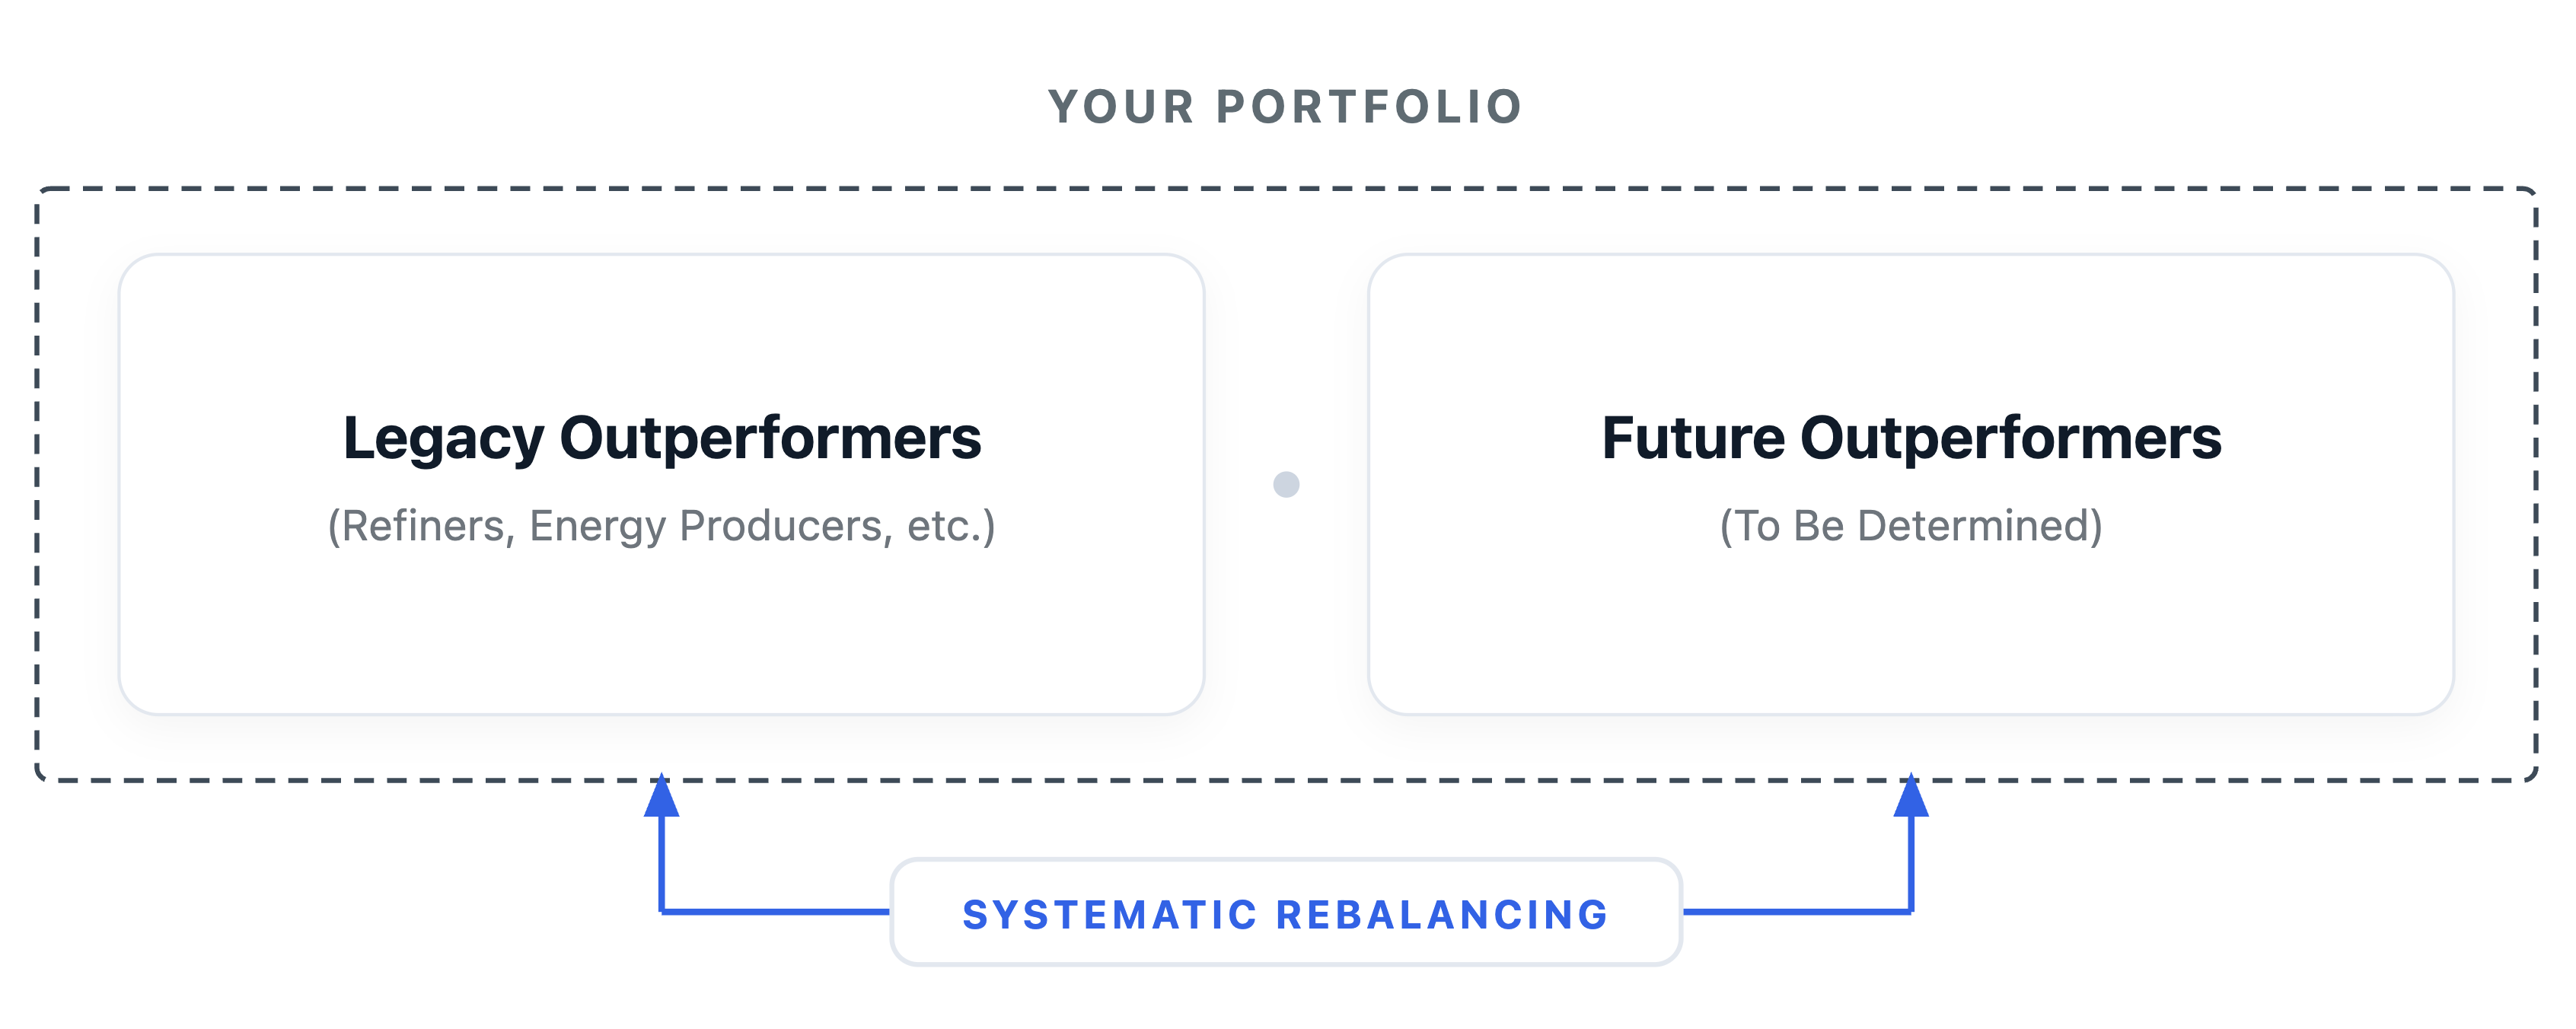
Broad-based equity indexes eliminate the need to pick single winners or predict complex market shifts. Furthermore, market-cap-weighted index funds automatically adjust as sector performances diverge. As outperforming sectors gain weight, index investors naturally capture that growth without executing a single discretionary trade.
The ultimate winners of any market disruption are rarely obvious at the start. Following the 1970s oil embargos, for instance, foreign automakers producing fuel-efficient cars emerged as major beneficiaries—a shift few predicted when crude prices first spiked. Those who benefit over the long-term from the 2026 oil shock will similarly become clear only in hindsight. While every crisis feels unprecedented, history shows that global markets adapt, evolve, and grow over time. Remaining passively invested helps to ensure you participate in that recovery without taking on unnecessary speculative risk.
Record crack spreads and Strait of Hormuz headlines make for compelling news, but these exciting daily occurrences should not dictate your financial plan. You don't need a military, diplomatic, or refining strategy to build long-term wealth.
By tuning out short-term noise and letting systematic rebalancing do the heavy lifting, your portfolio remains structurally designed to endure whatever headline comes next. Staying passive isn't just about ignoring the noise—it's an effective strategy for navigating oil shocks and preserving long-term growth.
One Day In July LLC is an SEC-registered investment advisor. Registration does not imply a certain level of skill or training. One Day In July LLC does not guarantee actual returns or losses. The content of this newsletter is for educational purposes only and is not investment advice. Individual circumstances may vary.
Sources:
[1] International Energy Agency (2025). Transport. https://www.iea.org/reports/energy-efficiency-2025/transport
[2] World Economic Forum (April 17, 2026). How Oil Prices Have Reacted to World Events Since the 1980s. https://www.weforum.org/stories/energy-transition/the-big-chart-price-of-oil-through-history/
[3] Kahneman & Tversky (1977). Prospect Theory. An Analysis of Decision Making Under Risk. https://web.mit.edu/curhan/www/docs/Articles/15341_Readings/Behavioral_Decision_Theory/Kahneman_Tversky_1979_Prospect_theory.pdf
[4] Federal Reserve Bank of Dallas (June 5, 2026). https://www.dallasfed.org/research/swe/2026/swe2614
[5] Bloomberg (July 16, 2026). Turning Oil to Fuel Has Never Been More Profitable as Refining Margins Surge. https://www.bloomberg.com/news/articles/2026-07-16/turning-oil-to-fuel-has-never-been-more-profitable-as-refining-margins-surge
[6] Reuters (July 16, 2026). Refiner Margins Hit New Records. https://www.reuters.com/business/energy/us-refiner-margins-hit-new-records-fuel-shortage-concerns-grow-2026-07-16/
[7] CNBC (June 10, 2026). Consumer Prices Rose 4.2% Annually. https://www.cnbc.com/2026/06/10/cpi-inflation-report-may-2026.html
[8] International Energy Agency (February 2026). Strait of Hormuz Factsheet. https://www.iea.org/about/oil-security-and-emergency-response/strait-of-hormuz
[9] Bloomberg (August 1, 2026). Fuel Prices to Endure as War Knocks Refining. https://www.bloomberg.com/news/articles/2026-08-01/exxon-chevron-warn-fuel-prices-to-endure-as-war-knocks-refining
[10] U.S. Department of State. Office of the Historian, Oil Embargo 1973-1974. https://history.state.gov/milestones/1969-1976/oil-embargo
[11] Congressional Research Service. Oil Market Disruptions and Historical Precedents. https://www.congress.gov/crs-product/R45281
[12] Federal Reserve History. Oil Shock of 1978-79. https://www.federalreservehistory.org/essays/oil-shock-of-1978-79
[13] Hamilton (2011). University of California, San Diego. Historical Oil Shocks. https://econweb.ucsd.edu/~jhamilton/oil_history.pdf
[14] International Monetary Fund (2016). U.S. Shale Revolution and Its Spillover Effects on the Global Economy. https://www.elibrary.imf.org/view/journals/026/2016/004/article-A002-en.xml
[15] Commodities Futures Trading Commission (November 23, 2020). Crude Contract Trading. https://www.cftc.gov/PressRoom/PressReleases/8315-20
[16] Federal Reserve Bank of Dallas (March 22, 2022). The Russian Oil Supply Shock of 2022. https://www.dallasfed.org/research/economics/2022/0322
[17] World Bank Group (April 2026). The Effects of Geopolitical Oil Price Shocks. https://www.lse.ac.uk/CFM/assets/pdf/CFM-Discussion-Papers-2026/CFMDP2026-08-Paper.pdf

v 2.4.161 | © One Day In July LLC. All Rights Reserved.


