Updated December 2025
For many investors, the promise of outsmarting the market has long held a powerful allure. The idea that sharper insights, faster reactions, or superior data might unlock above-average returns continues to inspire countless strategies and headlines.
Yet a cornerstone of capital-markets literature offers a stark counterpoint. In “A Random Walk Down Wall Street,” economist Burton G. Malkiel lays out a compelling case that asset-price movements are largely random. Through his conversational, often anecdotal style, Malkiel argues that stock prices tend to move unpredictably and that markets, more often than not, efficiently incorporate all available information. This perspective has fueled the rise of passive investing as a disciplined alternative.
The key tenet of the book, the random walk, supports the conclusion that active managers of equity portfolios are highly unlikely to beat their indices consistently over the long run, especially after accounting for fees and other costs. As the exchange-traded fund (ETF) market has matured, index returns (based on the same benchmarks that active managers have consistently been unable to outperform) have become available to all investors at a fraction of the cost of an actively managed fund.1But what exactly is a random walk, and what does it mean for today’s investors in terms of implications and opportunities?
By definition, the random walk hypothesis is a financial theory stating that stock market prices evolve according to random price changes and thus cannot be predicted. Malkiel’s theory aligns with the efficient-market hypothesis (EMH), which maintains that consistently outperforming the market is impossible. EMH also asserts that stock prices reflect all available information, making it extremely difficult to beat the market consistently on a risk adjusted basis. This has important implications for investors, suggesting that buying and holding a well-diversified portfolio may be a preferable long-term investment strategy. Indeed, this effect has been amplified by the advent of the information age, in which public information is available to everyone almost instantaneously.
The active vs. passive management debate is nothing new, and fortunately there is ample empirical evidence to evaluate. S&P Dow Jones Indices, LLC publishes their SPIVA U.S. Scorecard annually, which compares active managers’ returns to those of the relevant S&P indices. Table 1 below, extracted from the 2024 report, highlights 18 equity categories. The numbers in each row indicate the percentage of U.S. equity funds in each category that were unable to beat the appropriate benchmark index. Six time periods are shown, covering short- and long-term horizons, all measured through year-end 2024. The results are both revealing and remarkably consistent. Higher numbers indicate poorer performance by active managers relative to the indices (e.g. In the first category, we see that approximately 79% of all domestic funds underperformed the S&P Composite 1500 index return for the one-year period ending December 31, 2024).
Table 1 – Percentage of U.S. Equity Mutual Funds Underperforming S&P Index Return
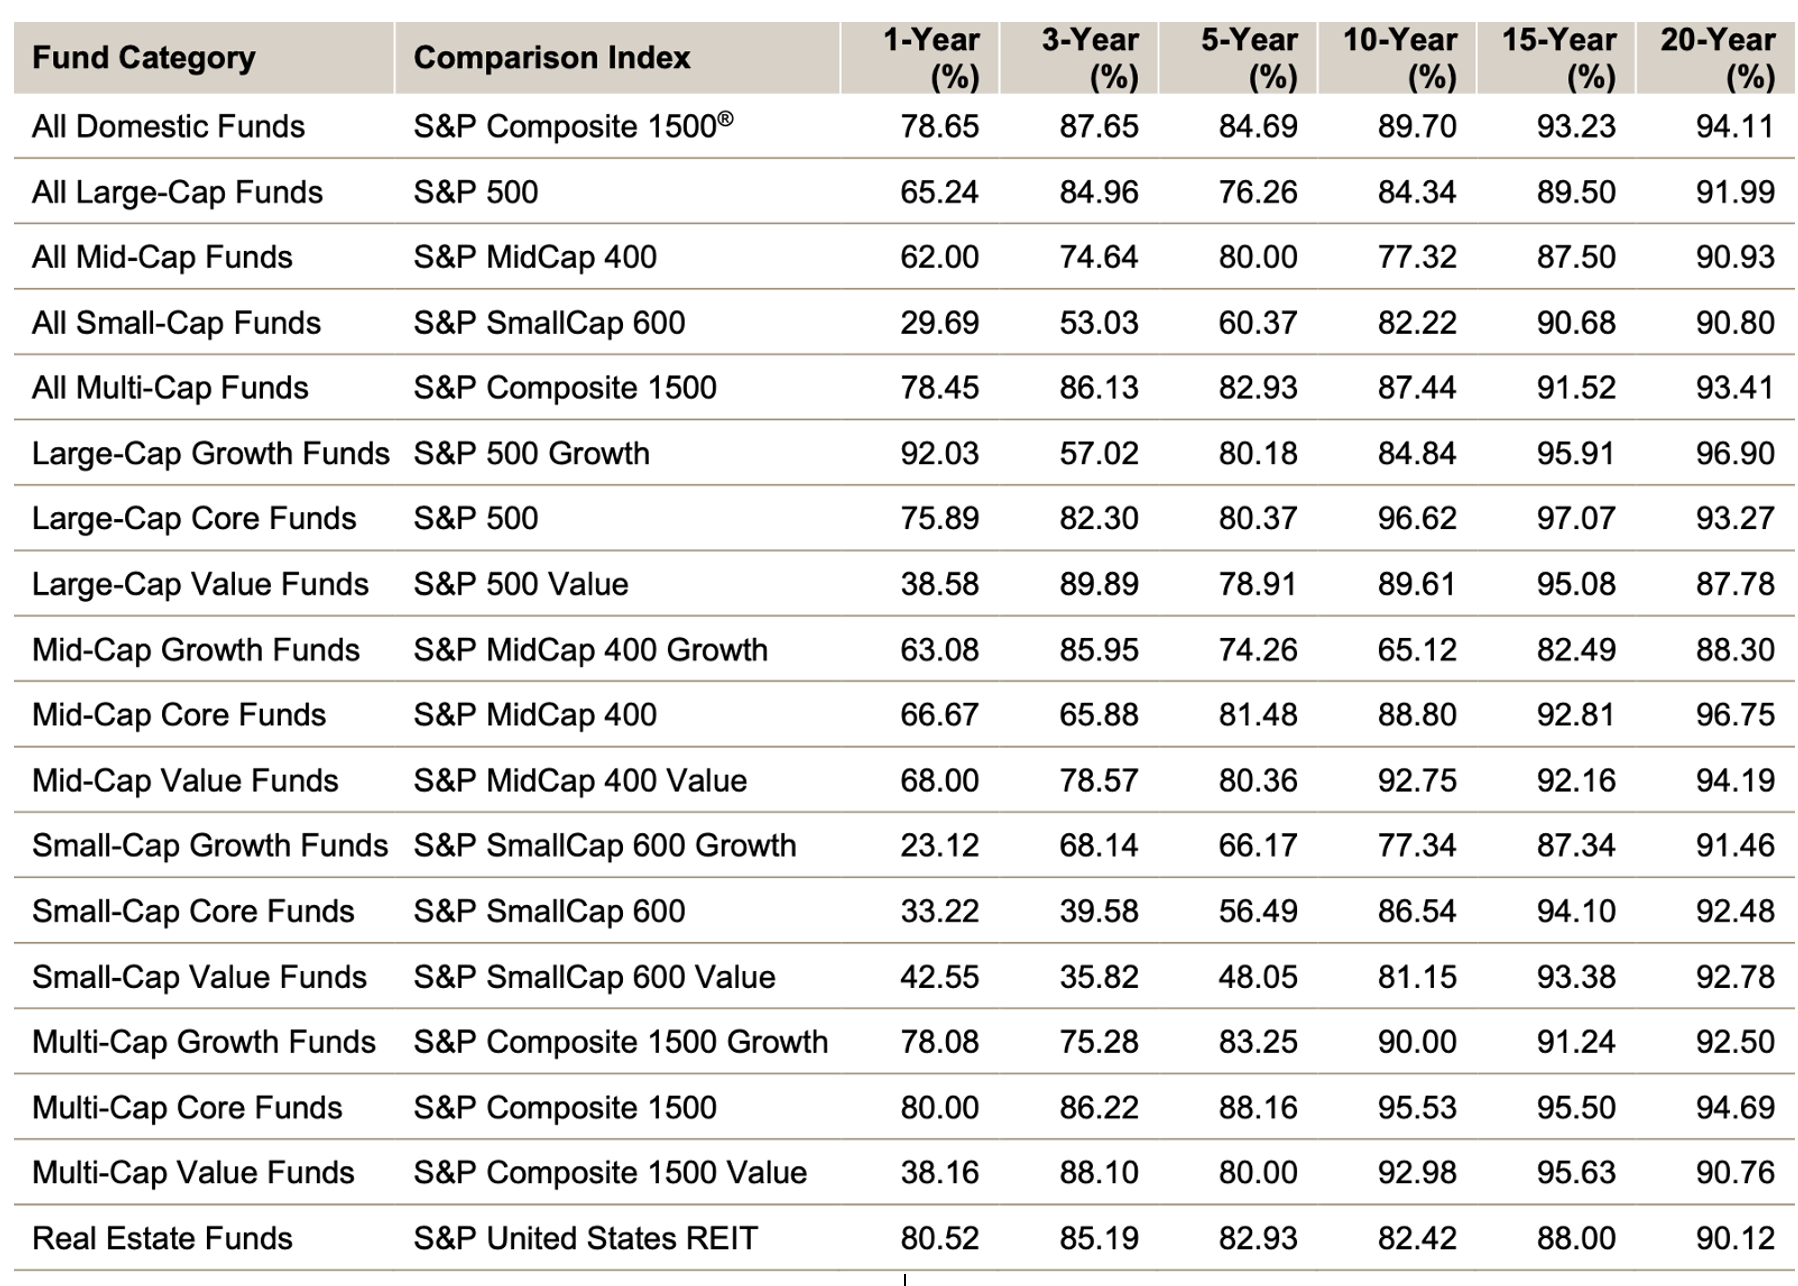
Source: S&P Dow Jones Indices LLC. As of December 31, 2024.
There are a few key takeaways from this table. Scanning the one-year column, performance was mixed in 2024. Small-cap growth managers had an excellent year relative to the S&P SmallCap 600 Growth index, with only 23.12% of funds failing to beat the benchmark. On the other hand, more than 92% of Large-Cap Growth managers underperformed their index. Of the 12 categories in the Growth, Core, and Value buckets, only seven reflected outperformance by more than 50% of the managers in 2024. That’s just over half, signifying that the chance of winning isn’t very good; and the outlook is even more bleak for active management the further out you look.
Reading from left to right across each row, you will see the numbers get progressively higher in all but a few instances. This validates the difficulty managers have consistently beating market indices in the long run. As one might expect, in any given year, active managers in some categories are likely to achieve a degree of success. However, as time passes, the random walk principle asserts itself and, combined with the impact of higher fees, pulls the long-term number of outperformers closer to zero.
This factor makes it difficult, if not almost impossible, for the average investor to select an asset manager that will outperform consistently and for the long term. Further, what happens frequently instead is that investors select the manager who did well last year, only to be disappointed further down the road with a less than stellar outcome.2 Let’s look at some actual performance numbers for active managers against the S&P 500 to quantify the magnitude of underperformance we’re talking about.
The degree of outperformance typically decreases over time. Table 2 below, depicting data from the S&P Global SPIVA U.S. Year-End 2024 report, illustrates the percentage of actively managed U.S. Large-Cap funds that outperformed the S&P 500 over various periods.3
Table 2 – Percentage of Active U.S. Large-Cap Funds Outperforming the S&P 500
| Time Period | % Active Funds Outperforming S&P 500 (Based on Absolute Return) |
|---|---|
| 1 Year | 35% (2024) | 3 Years | 15% |
| 5 Years | 24% |
| 10 Years | 16% |
| 15 Years | 10% |
| 20 Years | 8% |
Source: S&P Dow Jones Indices LLC. As of December 31, 2024.
For most investors, these numbers suggest that investing in a low-cost, passive S&P 500 index fund offers a higher probability of matching overall market performance than attempting to pick an active manager who can consistently beat the index over time. This level of consistent underperformance is significant for sure, but compounding this level of underperformance year over year makes the deficit all the more daunting. Considering the returns from passive management, why pay the significantly higher cost of active management?
The advent of the ETF market makes passive (indexed) investing accessible to all investors. Each ETF holds the same stocks as its corresponding index in the same proportions, providing a highly diversified portfolio with one vehicle. ETFs offer excellent liquidity as well, allowing you to buy or sell shares like any stock during market hours. This combination of diversification, liquidity, low cost, and stronger long-term performance is why ETFs remain one of the most practical investment options for investors of all sizes.
Notes:
1. Fees charged by active managers have continued to decline over time (perhaps due to competitive pressure from index funds), but they remain substantially higher on average than index-fund or index-ETF fees. According to the 2025 ICI Fact Book, the asset-weighted average expense ratio for U.S. equity mutual funds in 2024 was about 0.40%, compared with 0.05% for equity index mutual funds. For ETFs, the 2024 data show the asset-weighted average expense ratio for index equity ETFs was about 0.14%, while index bond ETFs averaged about 0.10%. These data reinforce the cost advantage of low-cost index mutual funds or ETFs compared with actively managed mutual funds, particularly over long investment horizons.
2. S&P Dow Jones also publishes an annual evaluation of performance persistence among active fund managers. The 2024 edition and prior editions have consistently shown that it is extremely difficult for managers to maintain performance in the top quarter or even top half of their peer group over longer measurement periods.
3. 2024 S&P Dow Jones Indices, LLC percentages have been rounded for ease of reading and clarity.
4. A comprehensive Morningstar report found that only 33% of actively managed mutual funds and ETFs outperformed their average index counterparts from July 2024 through June 2025, after fees were accounted for. This was a significant drop from the previous year and occurred even though market volatility was high, a time when active managers often claim they can outperform. Fixed-income funds experienced the largest drop in success rates.
Get Started Today.

v 2.4.123 | © One Day In July LLC. All Rights Reserved.
